Kubernetes observability from day one - Mixins on Grafana, Mimir and Alloy
One of the things we quickly find out when using Kubernetes is that it’s hard to know what is going on in our cluster. In most cases, we implement monitoring and alerting after we’ve dealt with problems, but there is a better way.
We don’t need to wait for the explosions, we can re-use the community’s knowledge and implement observability from the beginning.
What are Mixins?
The concept of a mixin comes from object-oriented programming, where a mixin is a class that provides methods that can be used to extend the capabilities of other objects without being inherited.
In observability, it’s a set of reusable, configurable components that we can use to extend our monitoring and alerting configuration without needing to change our infrastructure setup.
They effectively enable the sharing of knowledge and best practices.
Why do we need Mixins?
It would be great if we could all agree on metrics and labels, and be able to import dashboards and alerts. But that’s far from reality.
Because of different tools, configurations, environments, historical reasons, etc. we need a way to adapt the monitoring setup to our environment.
For example: what name do you use for the label to identify pods? Is it pod, pod_name, kubernetes_pod or something else? What about the namespace? Do you use namespace, k8s_namespace, kubernetes_namespace? What about nodes? node, instance_name, instance?
Do you have multiple clusters? Multiple scraping jobs? Are you using Prometheus, Prometheus operator, Alloy, or Cortex?
As you can see the possibilities are combinatorial. Mixins can adapt to our configuration.
Libsonnet, Jsonnet and Jsonnet-bundler
Mixins for observability are typically written in Jsonnet, a data-templating language that generates JSON or YAML.
Libsonnet is just a .libsonnet file extension, indicating a Jsonnet library that can be imported and reused.
Jsonnet-bundler (jb) is a package manager for Jsonnet, it can fetch and manage mixin dependencies.
This approach allows you to keep your monitoring configuration as code, version it, and adopt community best practices into your environment.
That’s useful in 2 ways, first by providing templating for JSON or YAML, and second by allowing to import libraries that can be reused across different mixins.
We can see this in action with the Grafana dashboards, the first line imports the grafonnet Grafana library, which provides functions to define dashboards and panels:
local g = import 'github.com/grafana/grafonnet/gen/grafonnet-latest/main.libsonnet';

local prometheus = g.query.prometheus;
local stat = g.panel.stat;
local timeSeries = g.panel.timeSeries;
local var = g.dashboard.variable;

{
  local statPanel(title, unit, query) =
    stat.new(title)
    + stat.options.withColorMode('none')
    + stat.standardOptions.withUnit(unit)
    + stat.queryOptions.withInterval($._config.grafanaK8s.minimumTimeInterval)
    + stat.queryOptions.withTargets([
      prometheus.new('${datasource}', query)
      + prometheus.withInstant(true),
    ]),

  local tsPanel =
    timeSeries {
      new(title):
        timeSeries.new(title)
        + timeSeries.options.legend.withShowLegend()
        + timeSeries.options.legend.withAsTable()
        + timeSeries.options.legend.withDisplayMode('table')
        + timeSeries.options.legend.withPlacement('right')
        + timeSeries.options.legend.withCalcs(['lastNotNull'])
        + timeSeries.options.tooltip.withMode('single')
        + timeSeries.fieldConfig.defaults.custom.withShowPoints('never')
        + timeSeries.fieldConfig.defaults.custom.withFillOpacity(10)
        + timeSeries.fieldConfig.defaults.custom.withSpanNulls(true)
        + timeSeries.queryOptions.withInterval($._config.grafanaK8s.minimumTimeInterval),
    },
  ...
This would be overkill for configuration that does not get shared across multiple projects.
Grafana Alloy
To visualize and alert on metrics, we first need to collect them. Alloy is an all-in-one solution to collect, process, and ship metrics.
It replaces multiple components in the observability stack, such as Prometheus (for scraping, not storing), Node Exporter, Promtail, OTel Collector, and more.
Alloy is a Grafana Labs product, and it is available as a managed service and as an open-source project. You can find more information at grafana.com/alloy.
Since it does so much, the configuration is not trivial, but the grafana/k8s-monitoring-helm Helm chart can save us a lot of time.
There is quite a lot packed into this chart, today we are interested in a few components:
alloy-metrics:
  enabled: true
clusterMetrics:
  enabled: true
  controlPlane:
    enabled: true
That’s all we need to enable Alloy to collect metrics from our cluster. It will configure Alloy to scrape the metrics and install metrics-server to expose the Kubernetes metrics API.
The next step is to ship these metrics somewhere. We can use Grafana Mimir as a destination for our metrics.
destinations:
- name: local-mimir
  type: prometheus
  url: http://mimir-nginx.monitoring.svc.cluster.local.:80/api/v1/push
Grafana Mimir
Another Grafana Labs product. Let’s let Copilot explain it:
Mimir is a horizontally scalable, highly available, multi-tenant, long-term storage for Prometheus metrics. It is the successor of Cortex and is designed to handle large amounts of metrics data.
I would call it a distributed Prometheus with long-term storage (in s3 for example). Compared to Prometheus, it’s a lot more complex to set up, but it should give us a few extra “ilities”. In practice, it’s easier to scale horizontally.
Again, Helm comes to our rescue, we’ll use the grafana/mimir-helm Helm chart.
This is the minimum size deployment I was able to achieve. It’s not great for a small development environment, it’s still overkill, but there is no ‘non-distributed’ Mimir setup.
mimir:
  structuredConfig:
  ingester:
    ring:
    replication_factor: 1
ingester:
  #Ingester must have 2 replicas
  replicas: 2
  zoneAwareReplication:
      enabled: false
store_gateway:
  replicas: 1
  zoneAwareReplication:
      enabled: false
federationFrontend:
  replicas: 1
minio:
  replicas: 1
querier:
  replicas: 1
query_scheduler:
  replicas: 1
Kubernetes Mixins
Since we want to keep an eye on our cluster, we’ll use the Kubernetes Mixin. We can find it in kubernetes-monitoring/kubernetes-mixin
It is a collection of configurable components (alerts, recording rules and dashboards) that can give us a good overview of our cluster. It also brings some basic application monitoring, since it can keep an eye on failed deployments, stuck jobs, resource usage, etc.
JSON generation
The output of the mixin is a collection of JSON files based on the configuration we provide.
We use jb to generate our files from the mixin.
We need to provide a configuration file to override the defaults, in this case, we want our monitoring to adapt to our Alloy and Mimir setup.
local kubernetes = import "kubernetes-mixin/mixin.libsonnet";

kubernetes {
  _config+:: {
    cadvisorSelector: 'job="integrations/kubernetes/cadvisor"',
    kubeletSelector: 'job="integrations/kubernetes/kubelet"',
    kubeStateMetricsSelector: 'job="integrations/kubernetes/kube-state-metrics"',
    nodeExporterSelector: 'job="integrations/node_exporter"',
    kubeSchedulerSelector: 'job="kube-scheduler"',
    kubeControllerManagerSelector: 'job="kube-controller-manager"',
    kubeApiserverSelector: 'job="integrations/kubernetes/kube-apiserver"',
    kubeProxySelector: 'job="integrations/kubernetes/kube-proxy"',
    podLabel: 'pod',
    hostNetworkInterfaceSelector: 'device!~"veth.+"',
    hostMountpointSelector: 'mountpoint="/"',
    windowsExporterSelector: 'job="integrations/windows_exporter"',
    containerfsSelector: 'container!=""',

    grafanaK8s+:: {
      dashboardTags: ['kubernetes', 'infrastructure'],
    },
  },
}
We are importing the kubernetes-mixin/mixin.libsonnet. Where did that come from? We need to install it from the Kubernetes Mixin repository.
cd mixins
jb init

# This will install the kubernetes-mixin to the ./vendor directory
jb install https://github.com/kubernetes-monitoring/kubernetes-mixin
You can now put your configuration in a file mixin.libsonnet. We have overridden only what’s different from the default configuration.
We are ready to generate!
jsonnet -J vendor -S -e 'std.manifestYamlDoc((import "mixin.libsonnet").prometheusAlerts)' > generated/alerts.yml
jsonnet -J vendor -S -e 'std.manifestYamlDoc((import "mixin.libsonnet").prometheusRules)' > generated/rules.yml

mkdir -p generated/dashboards
jsonnet -J vendor -m generated/dashboards -e '(import "mixin.libsonnet").grafanaDashboards'
Deploying the generated files
Here things get murky, there are multiple options and no clear winner. I would say that this should be treated like code, put under version control, and through CI to generate the files.
We have 2 quite different outputs: Prometheus rules (alerts and recording rules), and Grafana dashboards.
Alerts and Rules
Alerts and rules need to be both imported as rules into Mimir, the alertmanager will read the alert rules and create alerts based on its configuration.
One option to make it more GitOps friendly, would be to generate PrometheusRule resources from the generated files and apply them to the cluster. Alloy can read these resources and push them to Mimir.
Today we’ll keep it simple and use mimirtool to import the rules and alerts into Alloy. Let’s port forward the alloy-metrics service and load them.
mimirtool rules load --address=http://localhost:8080 --id=anonymous generated/alerts.yml
mimirtool rules load --address=http://localhost:8080 --id=anonymous generated/rules.yml
Grafana Dashboards
Here too, we have multiple options and no clear winner. If you are using the Grafana Operator, you can create GrafanaDashboard resources.
apiVersion: grafana.integreatly.org/v1beta1
kind: GrafanaDashboard
metadata:
  name: apiserver
  namespace: monitoring
spec:
  json: >
    {
       "editable": false,
        ...
       "panels": [
          {
             "datasource": {
                "type": "datasource",
                "uid": "-- Mixed --"
             },
             "description": "The SLO (service level objective) and other metrics displayed on this dashboard are for informational purposes only.",
        ...
Another option would be to use the Grafana API and import the dashboards with curl or grafana-cli.
curl -X POST http://localhost:3000/apis/dashboard.grafana.app/v1beta1/namespaces/default/dashboards \
  -H "Content-Type: application/json" \
  -H "Authorization: Bearer <YOUR_SERVICE_ACCOUNT_TOKEN>" \
  -d @mixins/generated/dashboards/apiserver.json
What I ended up doing instead was using the Grafana sidecar to read dashboards from ConfigMaps. We could put multiple dashboards in a single configmap but we need to stay under the 1MB size limit.
apiVersion: v1
kind: ConfigMap
metadata:
  name: apiserver
  namespace: monitoring
data:
  apiserver.json: |
    {
       "editable": false,
        ...
       "panels": [
          {
             "datasource": {
                "type": "datasource",
                "uid": "-- Mixed --"
             },
             "description": "The SLO (service level objective) and other metrics displayed on this dashboard are for informational purposes only.",
        ...
If you are using the Grafana Helm chart, you need to enable the sidecar. By default, it only imports from the same namespace.
sidecar:
  dashboards:
    enabled: true
We are done!
Grafana
If we head over to Grafana, we will find more dashboards, alerts and rules than we could ever dream of.
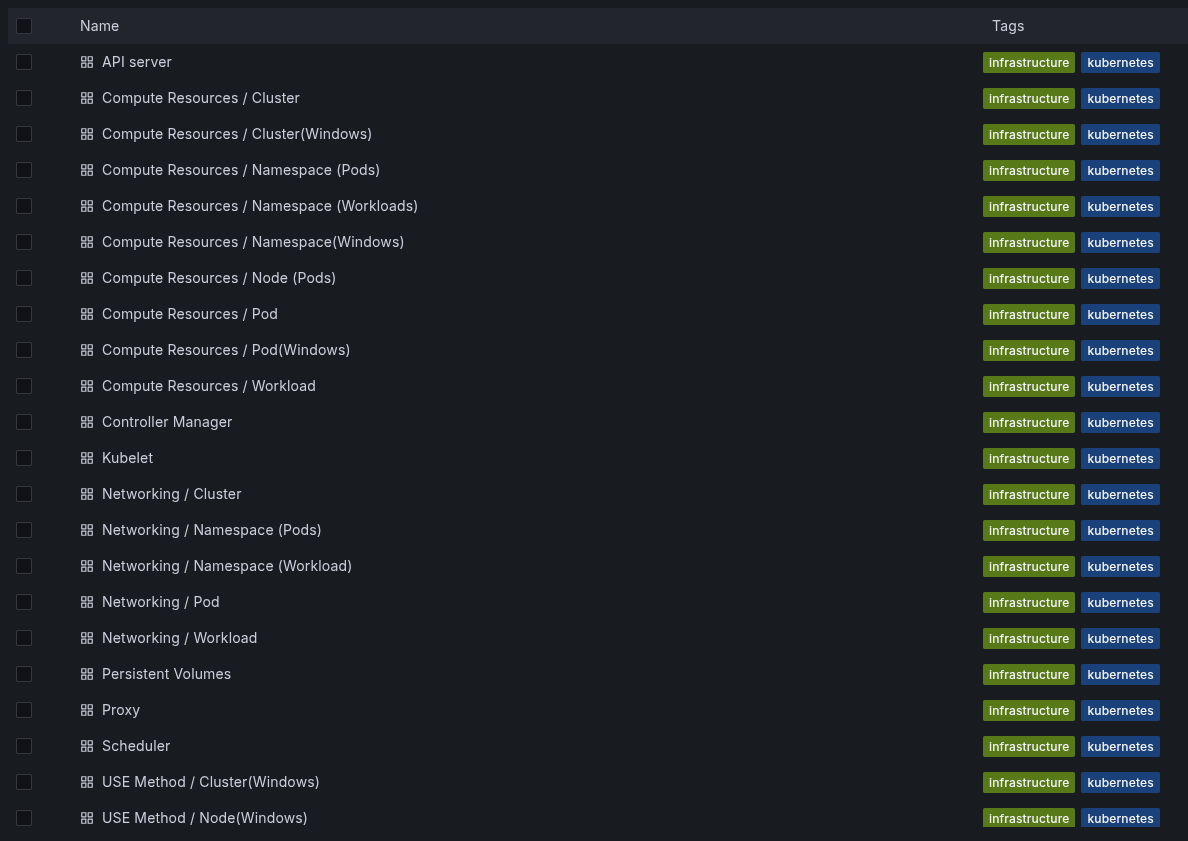
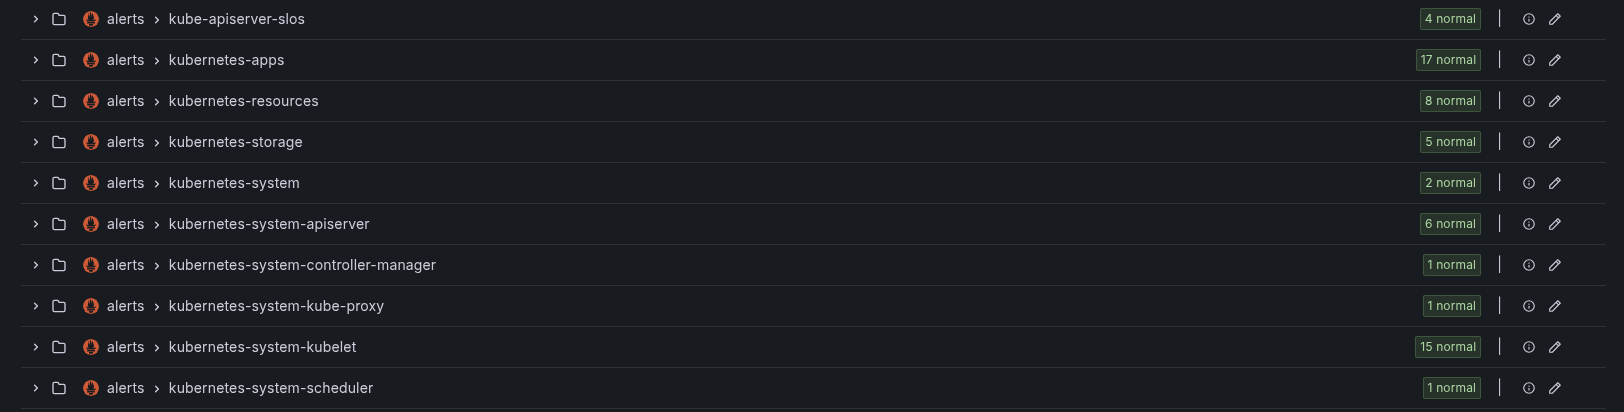
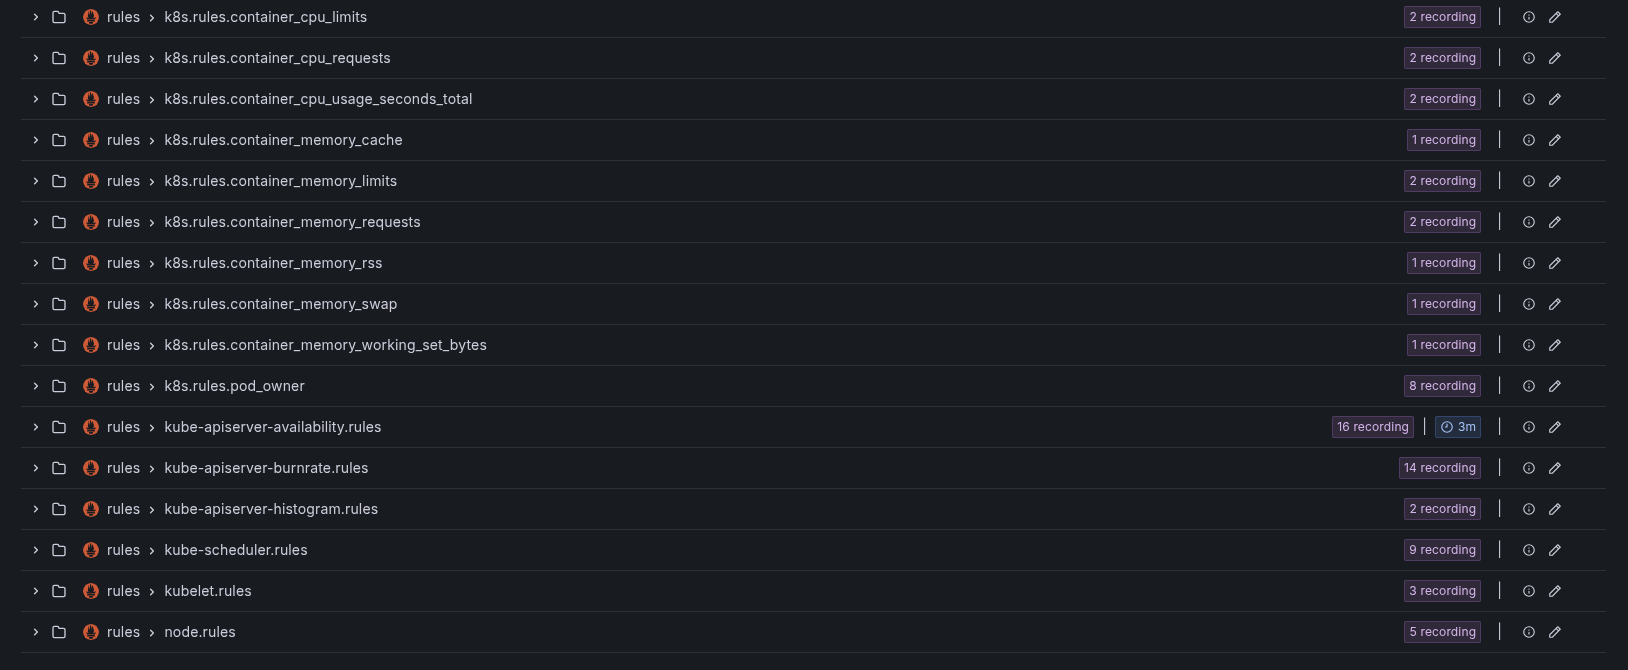
We can explore the dashboards and probably learn something new about our cluster(s).
What else to Monitor?
We were busy trying to get the Kubernetes Monitoring working and we added infrastructure that needs monitoring too. And guess what? There are mixins for that!
The same principle applies: we don’t need to start from scratch. There are Mixins available for monitoring Mimir, Alloy, and Grafana itself.
The repository nlamirault/monitoring-mixins is the most comprehensive list I’ve come across, but there are probably many more out there.
Test it out
You can test this setup locally on Kind, head over to driv/blog-k8s-monitoring-mixin and follow the README.
Conclusion
Grafana Alloy and Mimir work well together out of the box. But Mimir’s distributed architecture is overkill for most single-cluster setups.
Mixins are powerful, they can bring in an amount of knowledge and best practices that would take us a long time to gain on our own. But things are still not fully mature, there is no clear strategy to implement GitOps for the generated files. This makes me assume that the usage is not that widespread yet.
The building blocks are there. Don’t wait for the explosions, start with observability from day one.